
📐 基本的な太陽光発電出力方程式
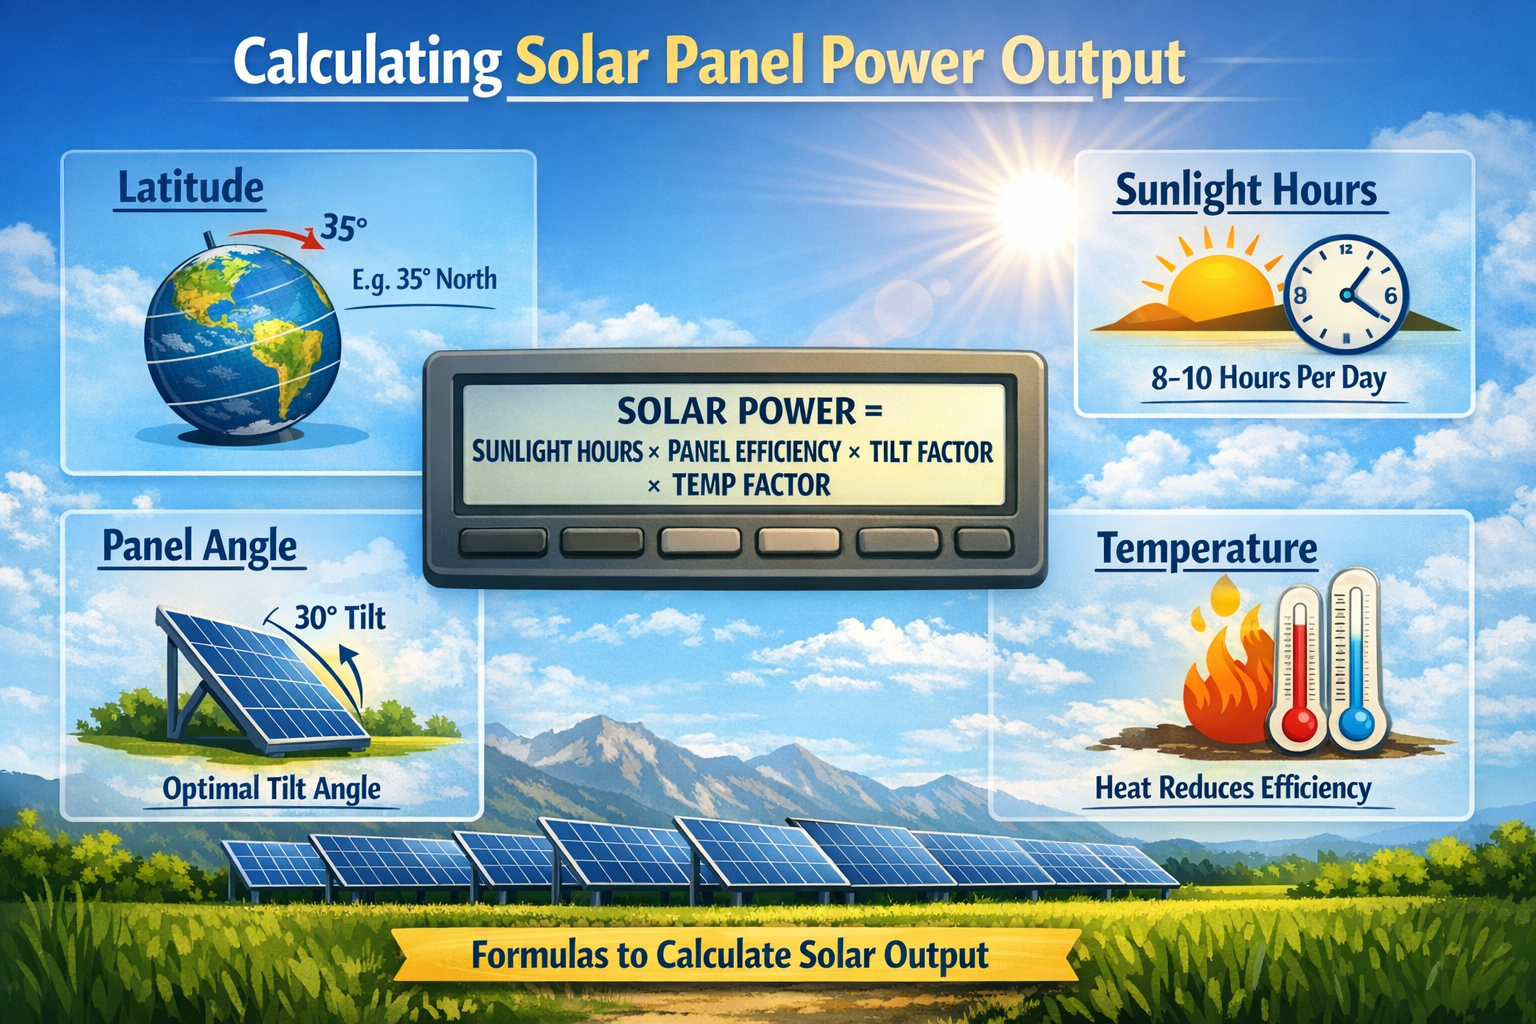
太陽光発電のエネルギー出力を見積もるために広く使用されている式 (PV) システムは次のとおりです [1]:
しかしながら, 特定の変数をより適切に統合するため, これをより詳細な形式に拡張できます, システムのサイジングに一般的に使用され、NREL の PVWatts などの認知されたモデルに実装されています。 [4]:
この拡張された方程式の各項を定義しましょう [4, 8]:
- PPV : 総エネルギー出力 (kWh単位) 一定期間にわたって (例えば, 毎日, 毎月, または毎年) または出力 (Wで) [4].
- Pstc : 太陽電池アレイの合計定格電力 (kWdcで) 標準試験条件下で (STC: の放射照度 1000 W/㎡, セル温度25℃) [1, 4]. これは、 “サイズ” あなたのシステムの.
- H傾ける : 毎日の, 毎月, または年間太陽照射量 (kWh/平方メートル単位) 太陽電池アレイの平面上で (アレイまたは POA の平面). ここが 緯度 と パネル角度 特定の設定が受ける太陽光を計算するために使用されます [5, 7].
- F温度 : 温度ディレーティング係数 (間の小数 0 と 1). これは、ソーラー パネルのセル温度が 25°C を超えると効率が低下することを考慮しています。 [1, 2, 8].
- F他の : 他のすべてのシステム損失の複合要因 (間の小数 0 と 1). これには汚れも含まれます (ほこり), シェーディング, 配線損失, インバータ効率, などなど [1, 4].
🔍 主要コンポーネントの詳細
この方程式を機能させるには, 具体的な値を決定する必要がありますHT私LTそしてFTとMP.
1. 傾斜面への照射 ()
これが最も複雑な部分です, あなたの場所を組み合わせると (緯度) そしてパネル角度. ある場所の年間最適な固定傾斜角は、多くの場合、その緯度によって近似されます。 [5]. しかしながら, 最大の精度を得るために, より微妙なアプローチが必要です.
- 固定傾斜角: ザ “黄金律” 傾斜角を緯度と同じに設定することです. 例えば, 北緯35度で, パネルは 35° 傾けて設置されることがよくあります [5].
- 計算中 H傾ける: 傾斜面での日射量を手動で計算するのは複雑です. 水平日射量データを直接成分と拡散成分に分割し、それらを傾斜面に転置する必要があります。 [7]. このため, 専門家は欧州委員会のようなツールを使用します PVGIS (太陽光発電地理情報システム) [3] またはNRELの PV ワット 米国で [4]. 現在地を入力すると (緯度/経度), パネルの傾き, とオリエンテーション (方位角), これらのツールは正確な値を提供します ヒルト. 最近のアプローチでは、機械学習を使用して、従来の等方性モデルと比較してこれらの推定の精度を向上させています。 [7].
2. 温度ディレーティング係数 (FTとMP)
ソーラーパネルは高温になると動作効率が低下します. この係数はこの効果を補正します [1, 2]. 式, PVWatts などのモデルに実装される, 以下のとおりである [4, 8]:
- c : メーカーが提供する電力温度係数. 結晶シリコン用, それは通常次のように表現されます %/℃で そしてネガティブです [6, 10].
- Tセル : 推定動作セル温度 (℃で). より洗練されたモデルでは、風速と日射量も考慮されます [1, 9].
- Tstc : 標準的なテスト条件でのセル温度 (STC), それはいつも 25℃で [4].
例えば, 業界データによると, モジュールの場合c=−0.4%/°℃, T細胞=65°℃, とTstc=25°℃, 電力損失が大きくなる [6]. 計算は:
これは、パネルが次の時間でのみ動作していることを意味します。 84% 高温により定格電力が低下する.
代表的な温度係数 (c) 価値観
以下の表は、さまざまなパネル技術の一般的な値を示しています。, 研究および業界データに基づく [2, 6, 10]:
| パネル技術 | 代表的な温度係数 (c) | 注釈 |
|---|---|---|
| 単結晶シリコン (古いBSF) | -0.45% へ -0.50% /℃で | 温度損失が大きい古いテクノロジー [6]. |
| 単結晶シリコン (モダンミニッツ) | -0.35% へ -0.40% /℃で | パフォーマンスを向上させた共通テクノロジー [6]. |
| 単結晶シリコン (N型TOPCon) | -0.29% へ -0.35% /℃で | 非常に優れた係数を備えた高度なテクノロジー [6]. |
| 単結晶シリコン (HJT – ヘテロ接合) | -0.25% へ -0.30% /℃で | 最高の係数を備えたプレミアムテクノロジー [6]. |
| 多結晶シリコン | -0.40% へ -0.50% /℃で | 古いテクノロジー, 一般に係数が高い [6]. |
| 薄膜 (CdTe) | -0.24% へ -0.25% /℃で | 暑さの中でも非常に優れたパフォーマンス [6]. |
| 現場で使用済みのモジュール | -0.5% /℃で (ηmの場合) | 老朽化したモジュールの測定により、これらの桁違いが確認されます [2]. |
3. その他のディレーティング要因 (Fザ·THは)
これは現実世界の非効率性をすべて網羅したものです. 適切に設計されたシステムの一般的な値は約0.75 へ 0.85 [1]. 個々の要素を掛け合わせることで計算できます [4].
💡 実用的な例
これらを組み合わせて、年間の単純な推定値を求めてみましょう。1 kWdcシステム PVWatts 式を使用する [4, 8].
- アレイパワー (Pstc): 1 kWdc
- 傾斜照射 (H傾ける): PVGIS などのオンライン ツールを使用したことがあるとしましょう。 [3] 特定の緯度と選択した傾斜に合わせて. ツールが出力するのは、 年間 H傾ける の 1700 kWh/㎡.
- 温度係数 (F温度): 地域の気候とパネルの仕様に基づく (例えば, c=−0.4%/°℃ [6]), 年間平均を計算すると、 ftempの 0.90.
- その他の損失 (F他の): 次の複合係数を推定します。 0.80 インバータ損失の場合, 汚れる, 配線, 等. [1, 4].
推定年間エネルギー生産量 (PPで) だろう [4]:PPで=1 kWdc×1700 kWh/㎡×0.90×0.80=1224 kWh
これはあなたのことを意味します 1 kWdc システムは約 1224 この条件下での年間電力量 kWh.
🧠 最も正確な結果を得るための推奨事項
- プロフェッショナルツールを使用する: 最も信頼できるもののために 値, 次のような確立されたツールを使用することを強くお勧めします PVGIS [3] または PV ワット [4]. 太陽の位置と放射線変換の複雑な幾何学を自動的に処理します。 [7].
- データシートを参照してください: 温度係数の最も正確な値 (c) 使用している特定のソーラー パネル モデルのメーカーのデータシートから常に取得されます。 [6, 10]. 探す “Pmaxの温度係数” または “電力温度係数”.
- 高品質の入力データを収集する: 方程式の精度は入力に依存します. サイト固有のデータを使用して、パネルの平均温度と正確な技術的詳細を把握します [1, 2, 9].
📚 参考文献リスト
[1] MDPI (2022). 熱伝達計算モデルによる太陽光発電モジュールの温度と効率の暗黙的な方程式。MDPI
[2] NIH(アメリカ国立衛生研究所) (2023). テーブル 3: の平均温度係数 3 現場で劣化した太陽光発電モジュール。ヘリオン
[3] シリット (日付なし). PV-GIS: ヨーロッパにおける太陽光発電の可能性を計算するためのウェブベースの日射量データベース。シリット
[4] NREL (2013). PVワットのバージョン 1 技術リファレンス。国立再生可能エネルギー研究所 (NREL)
[5] ハグフェイス (日付なし). Fiacre/PV-system-expert-500 · データセット。ハグフェイス
[6] 通衛 (2025). モノシリコンソーラーパネルの効率丨温度係数, 低照度パフォーマンス, 減衰率。通威株式会社, 株式会社.
[7] エネルギー変換と管理 (2024). 水平測定値から傾斜面の月間日射量を推定するための汎用ツール: 機械学習のアプローチ。エネルギー変換と管理
[8] pvlib-python ドキュメント (日付なし). pvlib.pvsystem.pvwatts_dc。ドキュメントを読む
[9] UNTデジタルライブラリー (1981). 太陽光発電と熱を組み合わせたシステムの分析および実験システムの研究. 技術状況レポート いいえ. 12. ノース テキサス大学
[10] IEEE (1997). PV モジュールとアレイの温度係数: 測定方法, 困難, そして結果。第26回IEEE太陽光発電専門家会議の会議記録