
Optimal Transformer Efficiency Using Weighted Average Loading: Beyond DOE 2016 — Mirus International
01 The DOE 2016 Problem: One Load Point Is Not Enough
In January 2016, the US Department of Energy introduced updated minimum efficiency standards for distribution transformers used in commercial buildings, codified under 10 CFR Part 431.192 — commonly known as DOE 2016.[2] The regulation requires 30% lower losses than the previous standard, measured at 35% of rated load, which was determined to be the most common operating point for commercial building transformers.[1]
The intent was sound — improve transformer efficiency at the load level where transformers spend most of their operating time. The unintended consequence was equally predictable: by specifying efficiency at only one load point, the regulation creates an incentive for manufacturers to optimize their designs at exactly 35% loading while accepting higher losses at other load levels. A transformer designed to pass a single-point test at 35% can have significantly higher losses at 50%, 65%, or 75% loading — precisely the load levels common in hospitals, data centers, and commercial facilities with moderate to high utilization.
1.1 The solar inverter precedent — CEC weighted efficiency
The California Energy Commission (CEC) recognized a similar problem for solar inverters, which operate across a very wide load range — zero at night, full load on a bright midday. A single-point efficiency specification would produce inverters optimized for one condition while underperforming at others. The CEC solution was a weighted average efficiency equation that weights each load point by the estimated fraction of operating time spent there:[1][3]
The heavy weighting at 75% (0.53) and 50% (0.21) reflects the reality that solar inverters spend most of their productive time at moderate to high output levels during daylight hours. A DOE 2016 transformer, optimized solely for 35% loading, would be entirely inappropriate for a solar inverter application — the CEC equation would expose its inefficiency at the load levels that matter most for this use case.[1]
Mirus International applied this logic to develop a solar transformer line that optimizes CEC weighted efficiency rather than the DOE 2016 single-point efficiency. A 50 kVA Mirus ULL-Solar transformer achieves a CEC weighted efficiency 0.45 percentage points higher than a conventional DOE 2016 design — translating to 21% lower average losses in typical solar system operation.
02 Extending Weighted Efficiency to Commercial Transformers
The CEC weighting was developed for solar inverters and reflects a solar load profile — peak weighting at 75% because solar generation peaks around midday. Commercial building transformers have different load profiles. Hospitals typically load transformers at 40–60%. Schools may load at 20–30%. Data centers and industrial facilities may run at higher utilization. The appropriate weighting depends on the actual load profile of the installation.[1]
The principle, however, is universally applicable: a weighted average efficiency equation that reflects the expected load profile will produce a better transformer selection than a single-point test at any fixed load level. Total cost of ownership — purchase price plus energy losses over the service life — is minimized when the transformer is efficient at the load levels where it actually operates, not at a regulatory test point that may not match the application.
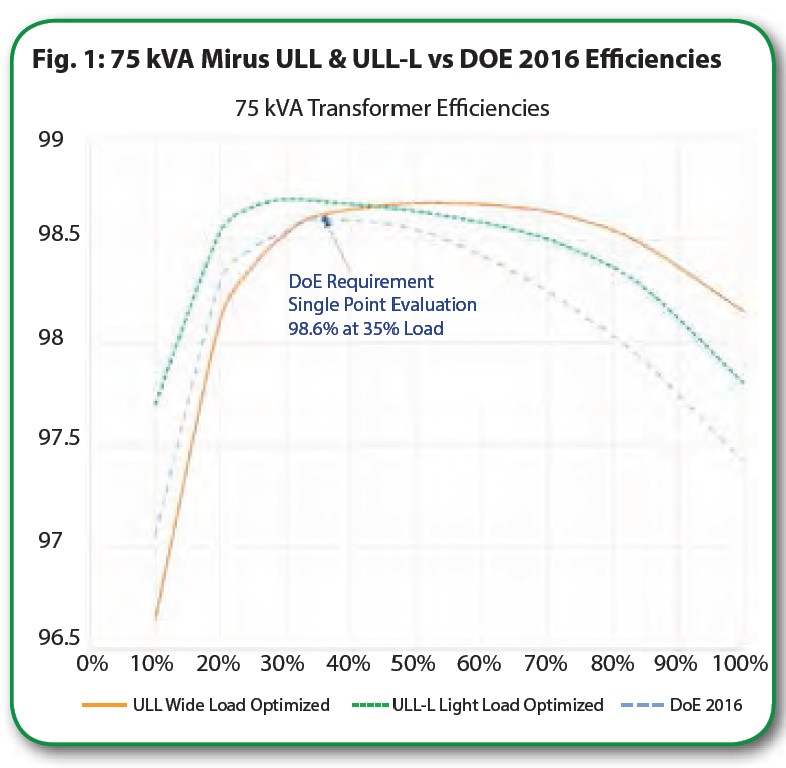
Fig. 1. Efficiency curves for 75 kVA transformers across the full load range: Mirus ULL (wide load optimized), Mirus ULL-L (light load optimized), and DOE 2016 standard design. The DOE 2016 design achieves its single-point target at 35% but diverges at higher load levels. Source: Mirus International / Electricity Today 2019.[1]
| Load % | DOE 2016 | Mirus ULL | Mirus ULL-L |
|---|---|---|---|
| 10% | 97.06 | 96.65 | 97.70 |
| 20% | 98.30 | 98.11 | 98.54 |
| 25% | 98.46 | 98.37 | 98.66 |
| 30% | 98.54 | 98.53 | 98.70 |
| 35% (DOE test point) | 98.60 | 98.62 | 98.69 |
| 50% | 98.55 | 98.68 | 98.64 |
| 65% | 98.34 | 98.66 | 98.55 |
| 75% | 98.14 | 98.60 | 98.44 |
| 100% | 97.42 | 98.15 | 97.80 |
| Weighted η (wider load range) | 98.47% | 98.62% | — |
The table reveals the DOE 2016 design’s weakness clearly: it peaks near 35% loading (its test point) but falls off significantly above 50%. The Mirus ULL maintains high efficiency from 35% through 100% — the load range where moderate to high utilization facilities actually operate. The Mirus ULL-L is optimized for light loading, maintaining superior efficiency below 35% at the cost of some efficiency at higher loads.
03 Proposed Weighted Efficiency Equations for Commercial Transformers
Hoevenaars proposes two weighted efficiency equations for commercial transformer specification — one for applications where loading is predominantly light (below 35%), and one for the wider load range typical of moderate to heavily loaded installations. Both use six load points, modified from the CEC equation to better reflect commercial building load profiles.[1]
The light loading equation places 87% of its weight at 25% and 35% load — appropriate for schools, offices with low equipment density, or any application where actual loading is consistently below 35%. The wider load range equation places 72% of its weight at 50% and 65% load — appropriate for hospitals, data centers, industrial facilities, and commercial buildings with high equipment utilization.[1]
3.1 Worked example — 75 kVA comparison
Applying the wider load range equation to the 75 kVA efficiency data:
DOE 2016: ηTranHL = 0.01×97.06 + 0.03×98.46 + 0.22×98.60 + 0.50×98.55 + 0.22×98.34 + 0.02×97.42 = 98.47%
Difference: 0.15 percentage points — representing approximately 15% lower losses at the weighted average operating condition.
The recommendation is to specify both DOE 2016 compliance at 35% loading AND weighted average efficiency compliance at the same efficiency level, using the equation appropriate for the expected load profile. This dual requirement guarantees a transformer that is highly efficient both at the regulatory test point and across the actual operating range — without accepting the hidden energy penalty of a single-point-optimized design.
04 What Makes the ULLTRA Different: Staggered Core Technology
Achieving high efficiency across a wide load range requires addressing both no-load losses (core losses) and load losses (copper losses) without compromising one to improve the other. The Mirus ULLTRA uses a proprietary core configuration — the staggered core — that addresses a fundamental limitation of both conventional interleaved cores and wound cores.[1]
4.1 The interleaved core — standard design
Conventional transformer cores use grain-oriented (GO) silicon steel laminations — steel whose crystalline grain structure is aligned in the rolling direction, providing low hysteresis losses when flux flows parallel to the grain. In an interleaved core, the flux in each leg is the vector sum of all three phase fluxes. The flux vectors mix evenly, and the total flux magnitude is √3 (= 1.732) times the individual phase flux — the expected value for balanced three-phase operation.
The problem with interleaved cores is at the corners. Where the vertical legs meet the horizontal yokes, the flux must change direction. Grain-oriented steel has 2–3× higher losses when flux flows against the grain — and in the corners of an interleaved core, the flux always flows against the grain. This is the primary source of excess no-load losses in conventional transformers.[1]
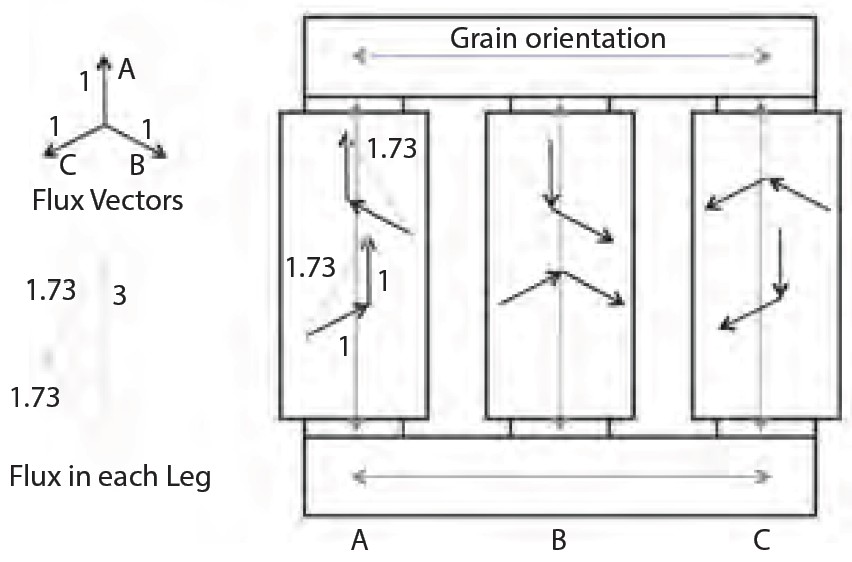
Fig. 2. Flux orientation in an interleaved transformer core. Each leg carries the vector sum of all three phase fluxes — total flux magnitude = √3 × individual phase flux. Flux mixes evenly in the legs but must change direction at the corners, producing elevated corner losses in grain-oriented steel. Source: Mirus International / Electricity Today 2019.[1]
4.2 The wound core — the Evans (Distributed Gap) design
Wound core configurations — the most common being the Evans Core (also called Distributed Gap or DG Core) — address the corner loss problem by maintaining the flux direction aligned with the grain throughout the core, including the corners. This eliminates the grain-direction mismatch at the corners and reduces no-load losses.
However, wound cores introduce a different problem that is frequently overlooked. In a wound core, the flux paths tend to remain contained within each wound section rather than mixing freely across the core. The flux pairs still sum, but they sum arithmetically rather than vectorially. The result is a total flux magnitude of 1.73 + 1.73 = 3.46 times the individual phase flux — approximately 15% higher than the √3 = 1.73 × individual phase flux of the interleaved core. This 15% higher flux produces proportionally higher core losses, partially offsetting the corner loss reduction.[1]
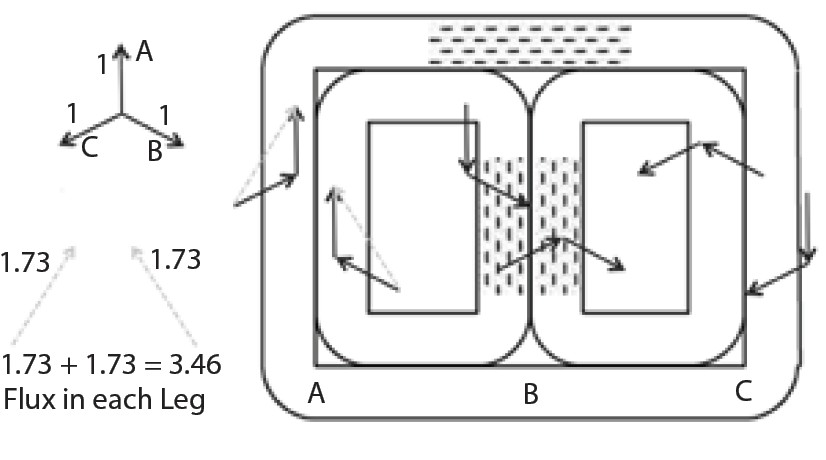
Fig. 3. Flux orientation in the Evans (Distributed Gap) wound core. Flux paths are contained within each wound section, preventing even mixing. Total flux = 1.73 + 1.73 = 3.46 × individual phase flux — 15% higher than the interleaved core. This higher flux partially offsets the corner loss savings. Source: Mirus International / Electricity Today 2019.[1]
4.3 The staggered core — the ULLTRA solution
The Mirus ULLTRA uses a staggered core configuration that captures the best characteristics of both approaches. The key innovation is using two different steel types in different parts of the core:[1]
- Grain-oriented (GO) steel in the legs — the flux in the legs flows parallel to the grain, so GO steel provides minimum hysteresis losses where the core carries the most flux
- Non-grain-oriented (NGO) steel in the corners — the flux changes direction at the corners; NGO steel has similar losses in all directions, so it does not penalize the corner flux direction change
This combination eliminates corner losses (the NGO steel is not penalized by flux direction changes) while allowing the fluxes to mix evenly in the legs (unlike wound cores where flux containment prevents even mixing). The result is a core that achieves lower total core losses than either the conventional interleaved core or the wound core design.
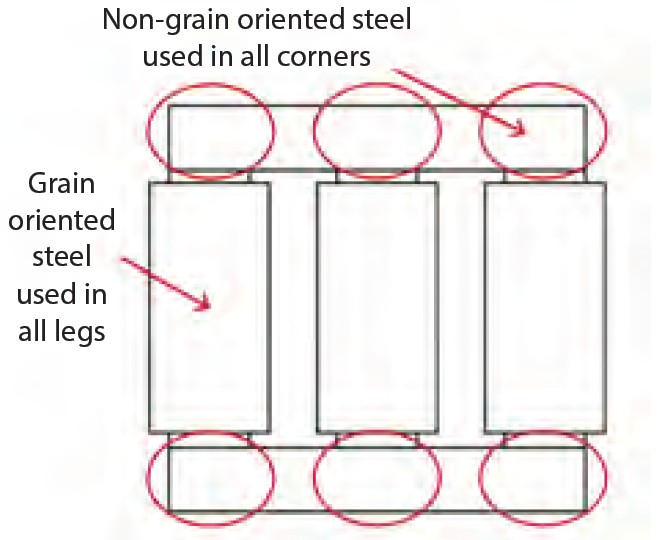
Fig. 4. Low loss staggered core configuration of the Mirus ULLTRA transformer. Grain-oriented (GO) steel in all legs — low losses where flux flows with the grain. Non-grain-oriented (NGO) steel in all corners — no penalty for flux direction change. Fluxes mix evenly in the legs, unlike wound cores. Source: Mirus International / Electricity Today 2019.[1]
05 The Power Quality Perspective
5.1 Transformer efficiency and power quality — a shared root cause
This article sits at the intersection of transformer efficiency engineering and power quality — a combination that might seem unusual but is directly relevant to any facility with significant VSD or other non-linear loading. The same harmonic currents that create power quality problems on the distribution bus also create additional losses in distribution transformers. A transformer designed to be efficient under harmonic loading is simultaneously less vulnerable to the harmonic heating that shortens transformer service life.
The ULLTRA’s lower no-load losses and the HMT variant’s harmonic cancellation capability address the transformer’s role as both an energy conversion device and a component of the power quality environment. This dual consideration is consistent with the broader theme of the IPQDF series: power quality and energy efficiency are not separate concerns — they are aspects of the same underlying electrical system design challenge.
5.2 The weighted average specification approach — a procurement lesson
The article’s core engineering argument — that single-point specifications produce suboptimal designs and that weighted average specifications better match real-world performance — applies well beyond transformer efficiency. It is the same argument that supports specifying harmonic filters by ITDD across the full operating range rather than THDi at a single load point (as demonstrated in the WQCP turbo blower case study). And it is the same argument behind specifying generator capacity based on harmonic-mitigated load rather than unmitigated load multiplied by a rule-of-thumb factor.
The common thread is: match the specification to the actual operating condition, not to a convenient test point. Total cost of ownership is minimized when the engineering specification describes what the equipment must do in service, not what it must do to pass a standardized test.
5.3 Rightsizing transformers — the same logic as generator rightsizing
The article’s closing point is that using the wider load range weighted efficiency equation allows for transformer rightsizing — selecting the correct kVA rating for the actual load rather than oversizing to achieve acceptable efficiency at the operating point. This is directly parallel to the generator rightsizing argument in the EGSA Powerline article: oversize to pass a single-point test, and you pay more in capital cost and operating losses than necessary. Design to the actual load profile, and both capital and operating costs are minimized.
For IPQDF readers working on distribution system design or equipment procurement, the weighted average efficiency framework proposed here is a practical tool. The two equations — light load and wider load range — can be applied to any transformer procurement specification where the load profile is known or can be estimated. The calculation is straightforward, and the data required (efficiency at six load points) should be available from any credible transformer manufacturer.
References
- [1] T. Hoevenaars, P.Eng., “Optimal Transformer Efficiency Using Weighted Average,” Electricity Today, Transformer Special Edition, Vol. 32, No. 3, pp. 14–16, 2019. Mirus International Inc., Brampton, Ontario, Canada.
- [2] US Department of Energy, “Energy Conservation Standards for Distribution Transformers,” 10 CFR Part 431.192 (DOE 2016), Federal Register, 2016.
- [3] California Energy Commission (CEC), “Eligibility Criteria and Test Methods for Inverters,” CEC-400-2019-013, 2019.