
Sinewave Filter vs. dV/dT Filter for Long-Cable VFD Applications: A Head-to-Head Field Comparison — Mirus International
| Client | San Antonio Water Authority — water lift stations |
| Application | Downhole water pump motors — 800 ft (245 m) cable depth |
| Sites tested | 1 of 6 identical installations (highest failure rate site selected) |
| Failure history | Mean time between failures 6–12 months; winding flashovers + bearing fluting observed |
| VFD switching frequency | 2 kHz |
| Original filter | LRC dV/dT filter |
| Test filter | Mirus AUSF INVERSINE sinewave filter |
| Test date | March 31, 2016 |
| Follow-up (Dec 2020) | Zero motor/pump failures on all 6 sites in 4+ years since INVERSINE deployment |
01 Operating Context: Downhole Motors, 800-Foot Cables, and Recurring Failures
The San Antonio Water Authority operates water lift stations that use variable frequency drives to control downhole pump motors. The motors are installed approximately 800 feet (245 m) below ground — a cable run that is long enough to create significant VFD output waveform problems even when the drive itself is operating perfectly. Six identical installations had been experiencing recurring motor and pump failures, with a mean time between failures of 6 to 12 months. Post-failure inspection of the failed equipment revealed two distinct damage signatures: winding flashovers (indicating differential mode dielectric stress) and bearing fluting (indicating common mode current).[1]
Each installation was equipped with a standard LRC dV/dT filter — the conventional solution for long VFD cable runs. The dV/dT filters had not prevented the failures. The question being investigated was whether a sinewave filter would perform better, and if so, by how much — quantified by direct field measurement rather than manufacturer specification.
02 What a dV/dT Filter Does — and What It Doesn’t
2.1 The dV/dT filter mechanism
A dV/dT filter is an LRC network inserted between the VFD output and the motor cable. Its purpose is to slow the rise time of each PWM voltage pulse — reducing the dV/dT (rate of voltage change) — so that the pulse appears less like a step function to the cable and motor impedance. By detuning the secondary circuit’s natural resonant frequency, it reduces the severity of reflected wave overvoltage and resonance conditions.[1]
What it does not do: it does not eliminate the PWM waveform. The output is still a series of pulses — slowed at their edges, but still switching between the positive and negative DC bus levels at 2 kHz. The fundamental PWM differential stress on the cable and motor insulation is reduced but not eliminated. The high-frequency current harmonic associated with the switching frequency is still present at the motor.
2.2 The common mode problem — what dV/dT doesn’t address
Common mode current in a VFD system flows from all three output phases simultaneously through stray capacitance to ground — through the cable jacket, motor frame, bearings, and any other conducting path to the system ground. It is distinct from differential mode (phase-to-phase) current. Common mode current through motor bearings produces electrical discharge machining (EDM) of the bearing races — a damage pattern called fluting, which was observed in the failed bearings at San Antonio.[1]
As Eaton’s Application Paper AP043001EN notes, a dV/dT filter may not be the best choice for common mode control, and a sinewave filter may be more appropriate. For longer cables, common mode current bleeds off along the cable length, making it lower at the motor than at shorter cable lengths — but with an 800-foot cable, the common mode current distribution and its bearing impact is complex and not simply reduced by cable length alone.[1][2]
Common mode noise: voltage stress from all phases to ground simultaneously, drives bearing current failure. Mechanism — stray capacitance between cable conductors and shield/armour, producing current that flows through motor bearings to ground.
A dV/dT filter addresses differential mode partially. A sinewave filter addresses differential mode completely and provides partial common mode mitigation. For complete common mode control, a sinewave filter with an integrated common mode choke is the appropriate solution.
03 Field Test Protocol: Three Measurement Points, One Drive
Testing was conducted on March 31, 2016 by Mike McGraw (NSOEM Inc.) and Aron Sekula (Five Star Electric), using an AEMC 8335 Power Quality Meter — selected specifically because it measures accurately to 3 kHz (the 50th harmonic), covering the 2 kHz switching frequency harmonics that are the dominant issue in this application. The test measured waveform and harmonic conditions at three sequential points:[1]
- Point 1: VFD inverter output — upstream of the existing dV/dT filter (baseline drive performance)
- Point 2: Output of the existing dV/dT filter (current standard installation performance)
- Point 3: Output of the Mirus INVERSINE AUSF sinewave filter, installed in place of the dV/dT filter

Fig. 1. San Antonio Water Authority water lift station — one of six identical VFD-driven downhole pump installations tested. Source: Mirus International / NSOEM Inc.[1]
3.1 Point 1 — VFD output baseline
The inverter output measurements confirmed normal drive operation — no resonance, phase imbalances, or other fault conditions. The VFD was performing within specification. The characteristic sawtooth current waveform and high THDv at the drive output are typical of a properly operating 2 kHz PWM inverter.[1]
| Phase | THDi (Arms) | THDv (Vrms) |
|---|---|---|
| A | 11.36% (136 A) | 37.91% (467 V) |
| B | 10.63% (132 A) | 38.74% (470 V) |
| C | 10.46% (131 A) | 37.94% (467 V) |
The True Power Factor of 0.575 vs. Displacement Power Factor of 0.785 indicates significant harmonic reactive power (kVAR = 100.4) being drawn — typical of a VFD output circuit with the dV/dT filter capacitive reactance downstream of the measurement point contributing to the reactive power measurement.
04 Measured Results: The Numbers Tell the Story
4.1 Point 2 — dV/dT filter output
The dV/dT filter produced only a minor improvement in voltage distortion — THDv dropped from ~38% to ~34%. The current waveform still exhibited a sawtooth pattern characteristic of PWM switching. The high-frequency current harmonic at the 2 kHz switching frequency remained present. True Power Factor improved marginally from 0.575 to 0.597.[1]
4.2 Point 3 — INVERSINE sinewave filter output
| Phase | THDi (Arms) | THDv (Vrms) |
|---|---|---|
| A | 7.24% (132 A) | 3.08% (412 V) |
| B | 8.05% (134 A) | 3.79% (413 V) |
| C | 8.60% (139 A) | 4.17% (413 V) |
The PWM waveform was completely eliminated at the filter output — replaced by a clean sinusoid. The voltage distortion dropped from 34%+ (dV/dT) to a maximum of 4.17% across all phases — a reduction of 87.9–90.9%. Reactive power consumption fell from 96.39 kVAR to 28.73 kVAR, a 70.1% reduction, improving True Power Factor from 0.597 to 0.660.[1]
4.3 The complete comparison
| Parameter | Inverter output (upstream of dV/dT) |
dV/dT filter output | INVERSINE output | Improvement INVERSINE vs. dV/dT |
|---|---|---|---|---|
| THDi | 10.46 – 11.36% | 10.61 – 11.32% | 7.24 – 8.60% | 24–32% reduction |
| I RMS | 131 – 136 A | 131 – 137 A | 134 – 139 A | +1.4–2.3% (minor increase) |
| THDv | 37.91 – 38.74% | 34.10 – 34.71% | 3.08 – 4.17% | 88–91% reduction |
| V RMS | 467 – 470 V | 450 – 451 V | 412 – 413 V | 8.4% lower — correct for 52–55 Hz operation |
| kVAR | 100.4 kVAR | 96.39 kVAR | 28.73 kVAR | 70.1% reduction |
| True PF | 0.575 | 0.597 | 0.660 | +10.6% improvement |
4.4 The 4-year follow-up
The most compelling data point in this case study was recorded not at the time of testing but four years later. The INVERSINE filters were deployed on all six lift station sites in 2016. As of December 2020 — the time of writing — zero motor or pump package failures had been recorded on any of the six sites. Against a previous mean time between failures of 6 to 12 months, this represents a complete elimination of a recurring failure mode across a four-year observation period.[1]
05 The INVERSINE Difference: Tuning Frequency Is the Key Variable
The INVERSINE AUSF is not simply a sinewave filter — it is a sinewave filter with a fundamentally different tuning approach from conventional products. The performance difference observed at San Antonio was a direct consequence of this tuning choice.[1]
5.1 Why 600 Hz tuning is insufficient
Most sinewave filters for 60 Hz applications are tuned near 600 Hz — the 10th harmonic. This places the filter cutoff frequency well above the fundamental but below the switching frequency of the drive. However, 600 Hz is close enough to the switching frequency region that switching-frequency harmonics at 2 kHz and above are not fully attenuated. Residual high-frequency voltage content remains in the filter output — measurable above the 50th harmonic (3,000 Hz on a 60 Hz system). This residual content continues to impose dielectric and thermal stress on the secondary circuit.
5.2 The INVERSINE tuning approach — approximately 180 Hz
The INVERSINE is tuned to approximately 3× the fundamental frequency — around 180 Hz on a 60 Hz system. This is a full decade below the 2 kHz switching frequency, providing far deeper attenuation of all switching-frequency harmonics. The result is a filter output that meets <5% THDv even when measured up to the 100th harmonic (6,000 Hz on a 60 Hz system) — something conventional 600 Hz-tuned filters rarely achieve above the 50th harmonic.[1]
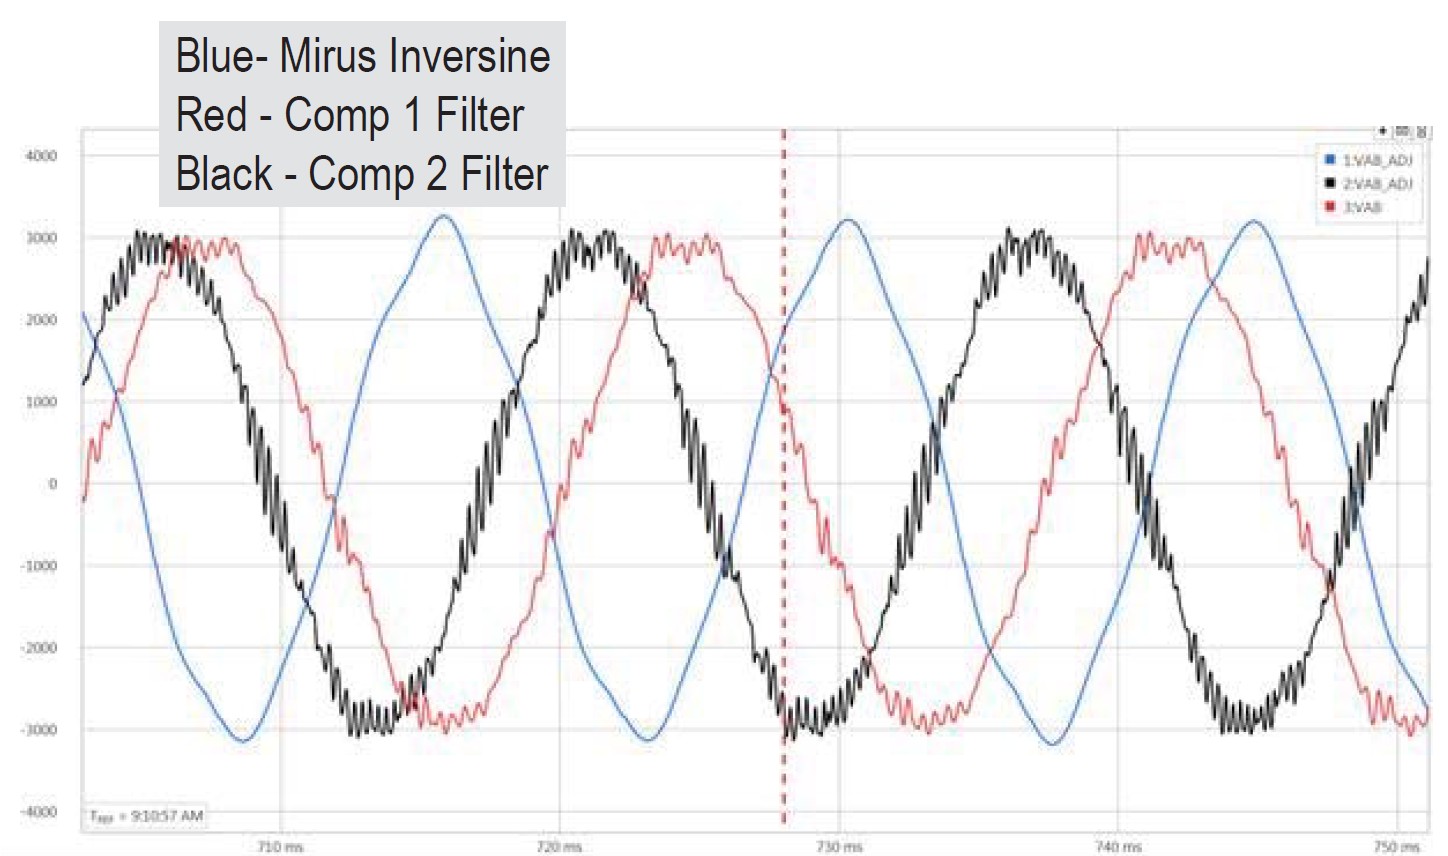
Fig. 2. Three-way sinewave filter output comparison: Mirus INVERSINE (blue) vs. Competitor 1 (red) vs. Competitor 2 (black). The elimination of high-frequency voltage noise with the INVERSINE tuning is clearly visible. Conventional 600 Hz-tuned filters show residual high-frequency ripple. Source: Mirus International.[1]
5.3 Additional INVERSINE advantages vs. conventional sinewave filters
- Power factor correction: The INVERSINE capacitors are sized to supply most of the motor’s inductive reactive power, improving displacement PF at the inverter output to near unity. Conventional filters are not designed for PF correction — motor PF remains lagging.
- Lower insertion loss: INVERSINE voltage drop is below 3%, vs. 5–12% for competing filters. Lower insertion loss means the motor receives higher terminal voltage, reducing current and associated losses.
- No damping resistors: The lower tuning frequency eliminates the resonance conditions that require damping resistors in conventional designs. Resistors add insertion loss and generate heat — their absence in the INVERSINE makes it more efficient and simpler.
- Natural convection cooling: The lower loss design allows natural convection cooling rather than fan cooling required by some competing products — reducing maintenance requirements.
- Efficiency advantage: 1.5–2% more efficient than competing sinewave filters, directly reducing operating costs.
06 The Power Quality Perspective: What This Case Study Illustrates
6.1 The dV/dT filter as a partial solution
The San Antonio case demonstrates with measured data what the ESP motor case study earlier in this series established theoretically: a dV/dT filter is an incomplete solution for long VFD cable applications. It reduces the dV/dt of voltage pulses and thereby mitigates reflected wave overvoltage — but it does not eliminate the PWM waveform, and it does not address the continuous differential mode dielectric stress associated with the high-frequency voltage switching content.
The dV/dT filter’s 34% THDv output vs. the INVERSINE’s 4% THDv output tells this story directly. A 34% THDv at the motor terminals means the motor insulation system is continuously stressed by voltage harmonics far above its design operating condition. Even if individual pulse overvoltages are reduced, the cumulative dielectric stress over a 6–12 month period is sufficient to cause winding flashover failure.
6.2 Specifying by outcome, not by convention
The conclusion from this case study is a specific specification recommendation: for VFD/ASD secondary circuits with long cable runs, specify maximum THDv ≤ 5% and maximum THDi ≤ 8% at full load at the motor terminals — not simply “install a dV/dT filter.” A performance specification forces the solution to address the actual problem rather than applying a conventional answer that may be inadequate for the specific application conditions.
6.3 The case for field testing over manufacturer claims
The San Antonio test was explicitly designed to generate measured field data rather than rely on manufacturer specifications. As the authors noted, dV/dT filter literature often makes claims about common mode reduction and motor life extension without providing the technical data to support them. The three-point measurement protocol — inverter output, dV/dT output, sinewave filter output — produced directly comparable data under identical operating conditions on the same drive and cable. This is the correct way to evaluate competing filter technologies, and the result was unambiguous.
References
- [1] M. McGraw (NSOEM Inc. / Mirus International) and A. Sekula (Five Star Electric), “Mirus Series AUSF Inversine Sinewave Filter versus dV/dT Filter Discussion: San Antonio Water Authority Case Review,” Technical Case Review, Mirus International Inc., Brampton, Ontario, Canada, December 2020. Available: mirusinternational.com/inversine
- [2] Eaton Corporation, “Applying dV/dT Filters with AFDs,” Application Paper AP043001EN, Effective September 2014.